Table of Contents
BrightonSEO Presentation
Introduction
Though advertisers can already directly see a good proportion of value from their adverts via engagement or form fills, it's likely they are missing out on at least a reasonable amount of the impact.
What if we could measure whether advert impressions lead to website visits or even sales - without the need for clicks?
This guide will outline how - using the LinkedIn API, fuzzy matching and IP look up services.
Want to get automated recommendations to improve your landing pages for LinkedIn? contentEnhance uses Google Analytics 4 data and AI to accelerate your success, with actionable content analytics
The Value of LinkedIn for Advertisers
LinkedIn has made a strong case for itself in the advertising domain.
A significant 40% of B2B advertisers affirm that they source quality leads from LinkedIn - likely from 'Lead Gen Form' ad formats, for example.
However, the full potential of these LinkedIn ads remains unknown for many, given that the average click-through rate to websites stands at a mere 0.08%.
The Quest to Connect LinkedIn Activity with Sales
The underlying question for many advertisers is: How can we determine if our LinkedIn activity is having an affect on sales?
LinkedIn's user interface does provide some insights on ad engagement and views:
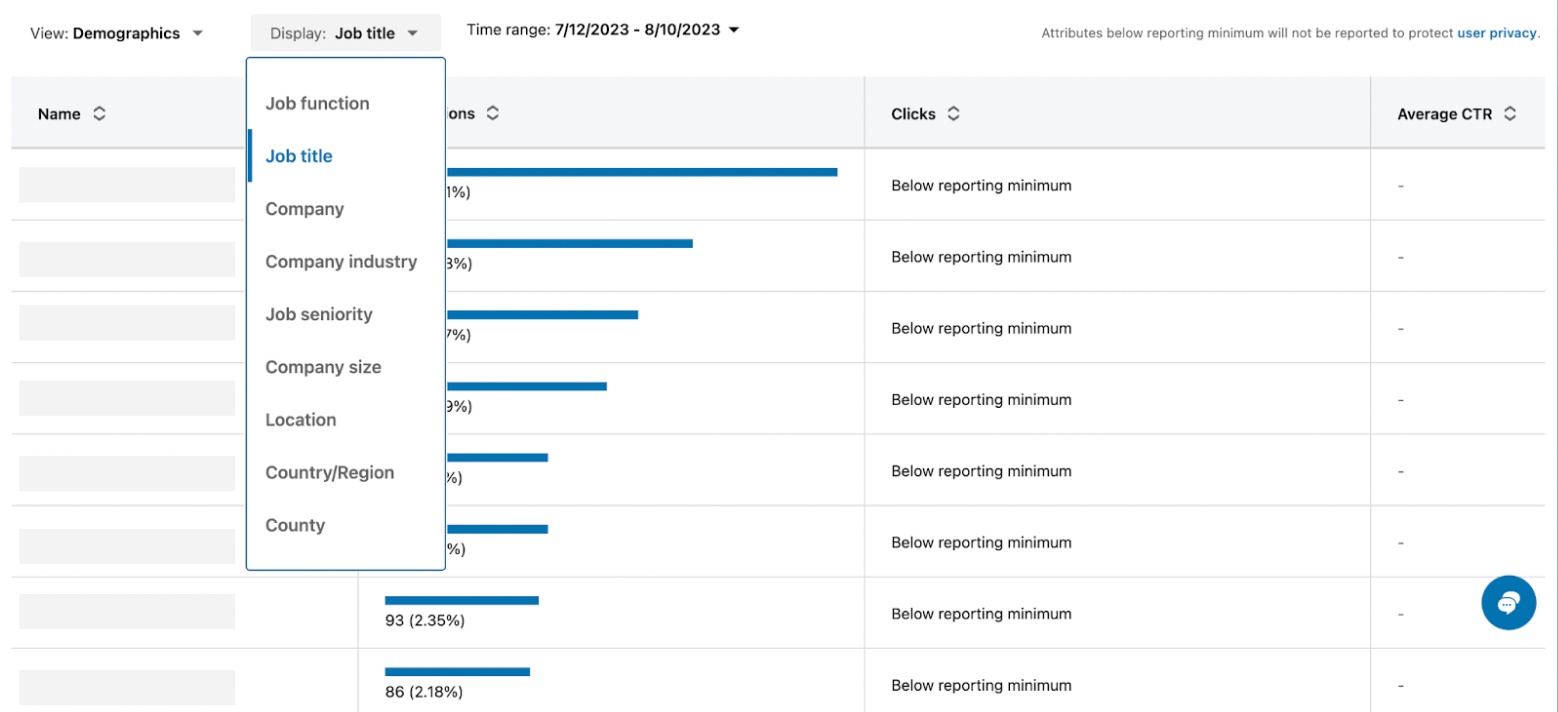
However, this barely scratches the surface:
- It doesn't give you all organizations that have seen your ads - only a selection
- It doesn't give you creative/advert level data
Most businesses yearn for deeper, ad-level insights and a comprehensive view of all organizations that saw an advert or campaign.
Getting Started with the LinkedIn API is the First Step
The LinkedIn API gives you a lot more. To harness the true potential of LinkedIn ads, integration with the LinkedIn API is essential.
What you need to do to get started:
- You need to request access to the API by filling out a form in the Developer Portal: confirmation can take around a day or two.
- You then need to generate an API token
Once you have access, you'll need to extract that data. Here's some starter code for getting up and running with extracting data the LinkedIn API:
import requests
import pandas as pd

# Set the API endpoint URL
url = "https://api.linkedin.com/v2/adAnalyticsV2"
# Set the API headers
headers = {
    'Authorization': '' #Add your token here
}

params = {
        'q': 'analytics',
        'accounts[0]': 'urn:li:sponsoredAccount:', #Add your account ID here
        'dateRange.start.day': '01',
        'dateRange.start.month': '02',
        'dateRange.start.year': '2023',
        'dateRange.end.day': '01',
        'dateRange.end.month': '02',
        'dateRange.end.year': '2023',
        'pivot': 'MEMBER_COMPANY',
        'timeGranularity': 'DAILY',
        'fields': 'pivotValues,dateRange,clicks,impressions,actionClicks,adUnitClicks,costInLocalCurrency,costInUsd,externalWebsiteConversions,videoStarts,videoViews,videoCompletions,totalEngagements,videoMidpointCompletions,reactions,follows,comments,approximateUniqueImpressions,registrations'
        }
response = requests.get(url, headers=headers, params=params)
table = response.json()
data = table['elements']
df = pd.DataFrame(data)
df
Alternatively, you can run this in Google Colab.
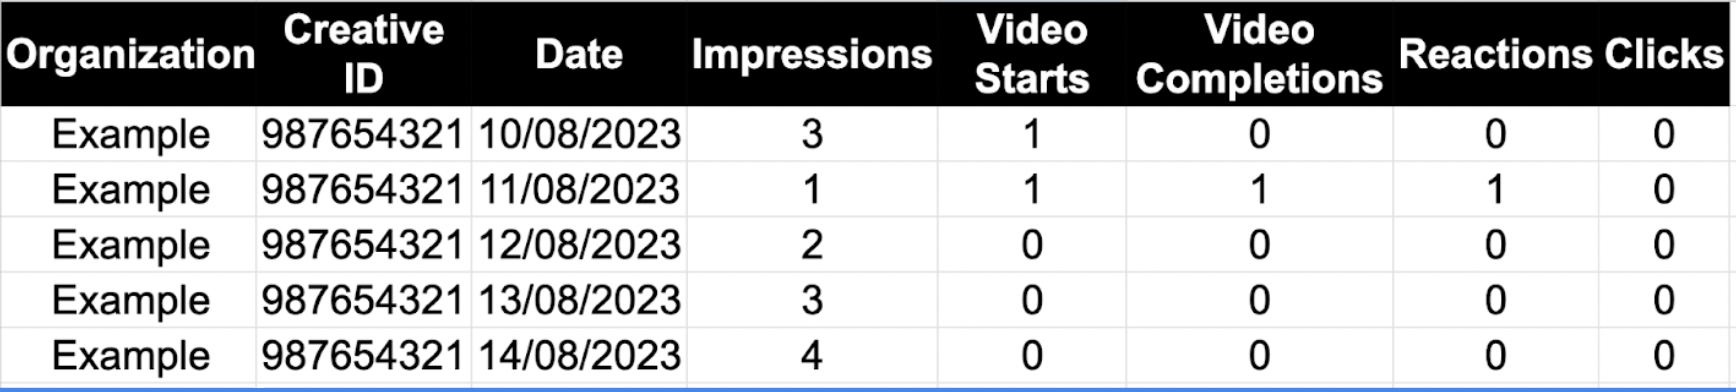
This is the rough format of the data you'll receive:
Two Pioneering Methods to Track LinkedIn's Impact
- Analyzing the Impact on Sales Only: This method exclusively examines the influence of LinkedIn activity on sales.
- Analyzing the Impact on Website Behavior: This strategy delves deeper by studying the effect of LinkedIn activity on website interactions.
1. Analyzing the Impact on Sales Only
To derive meaningful insights, businesses need to merge their CRM data with LinkedIn data. This can be achieved using fuzzy matching algorithms. Such algorithms can help businesses discern patterns, such as whether video posts are more likely to lead to conversions.
Harnessing Data from CRM Platforms
Firstly you need to extract sales data from your CRM - such as Salesforce. You only need the basic information, such as business name, whether they are client and the date they became a client.
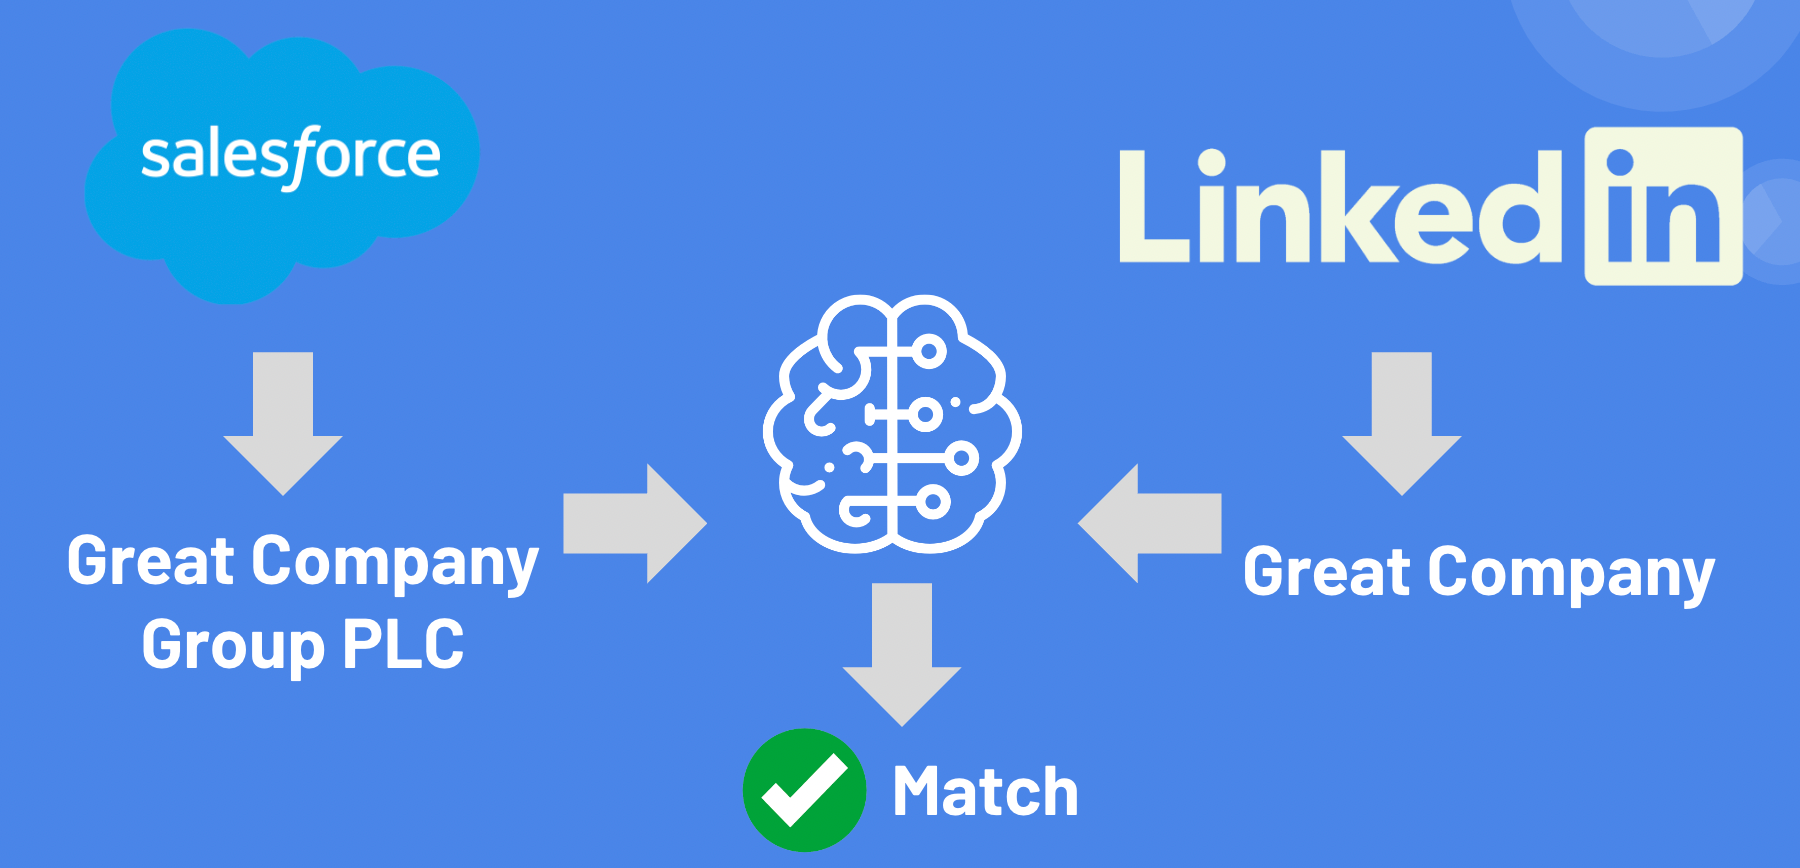
Fuzzy Matching CRM Data to LinkedIn API data
Once you have the data from your CRM, you can fuzzy match the names from the CRM system to the data you extracted via the LinkedIn API, allowing you to augment with all of the LinkedIn data points you have extracted (e.g. impressions):
Here's some code for a fuzzy matching algorithm as a starter:
import pandas as pd
from fuzzywuzzy import fuzz

# Sample data with famous company names
data = {
    'Column_A': ['Apple Inc.', 'Google LLC', 'Microsoft Corp.', 'Facebook, Inc.', 'Amazon.com Inc.'],
    'Column_B': ['Apple', 'Gogle', 'Microsft', 'Facebok Inc.', 'Amazone']
}

df = pd.DataFrame(data)

# Fuzzy match columns and get the ratio
df['Match_Score'] = df.apply(lambda row: fuzz.ratio(row['Column_A'], row['Column_B']), axis=1)

print(df)
Alternatively, you can open this in Google Colab.
Gotcha
By default, LinkedIn will give you an organization ID instead of the organization name when you extract data using the API. In order to fuzzy match the organization names to the names contained within your CRM system, you will need to lookup the organization ID using the organizationsLookup endpoint.
Getting the Data into the Right Format
Once you have the businesses that are your current clients and the LinkedIn data associated with that business (via the fuzzy match), you need to ensure the data is in the right format so that you can start to assess what the most important features for driving sales via LinkedIn. You probably want to answer questions such as:
- Which is the best ad format for driving sales?
- Which is the best performing campaign?
- Which is the best performing campaign group?
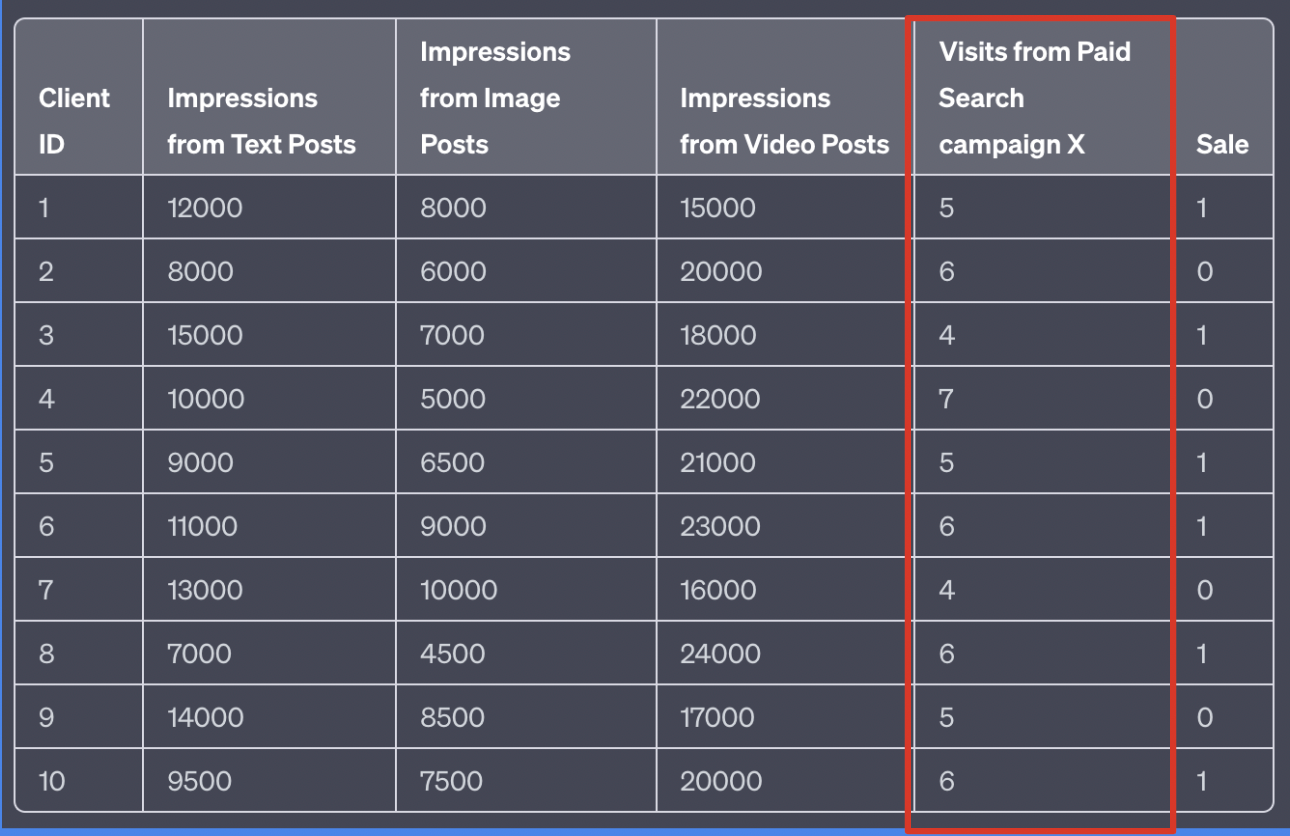
Here's the format you need - the business, a column for each 'feature' that you want so assess with the value for the associated business. And crucially, whether the business went on to become a sale or not:
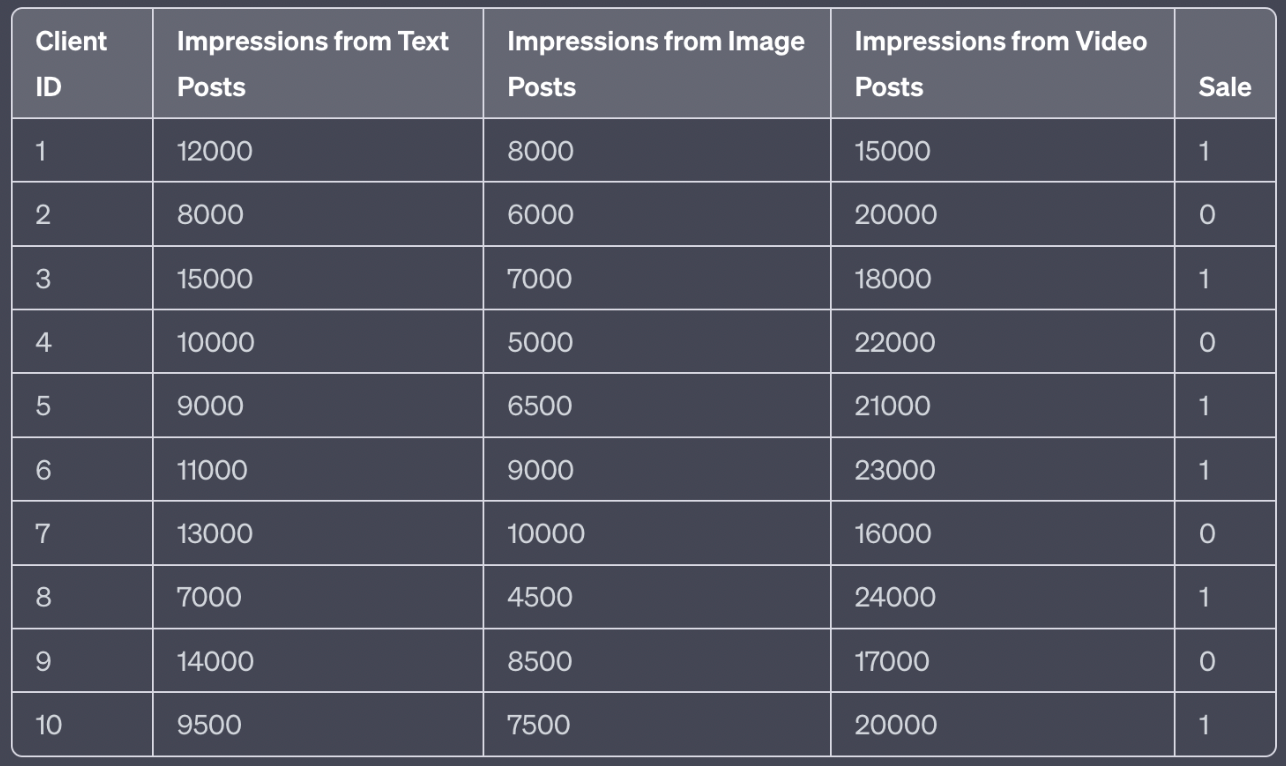
As you can see, you could have columns for:
- Number of impressions via video/image/text ads
- Number of impressions for each campaign
- Number of impressions for campaign groups
As long as it is a value associated with each business (Client ID in the image above).
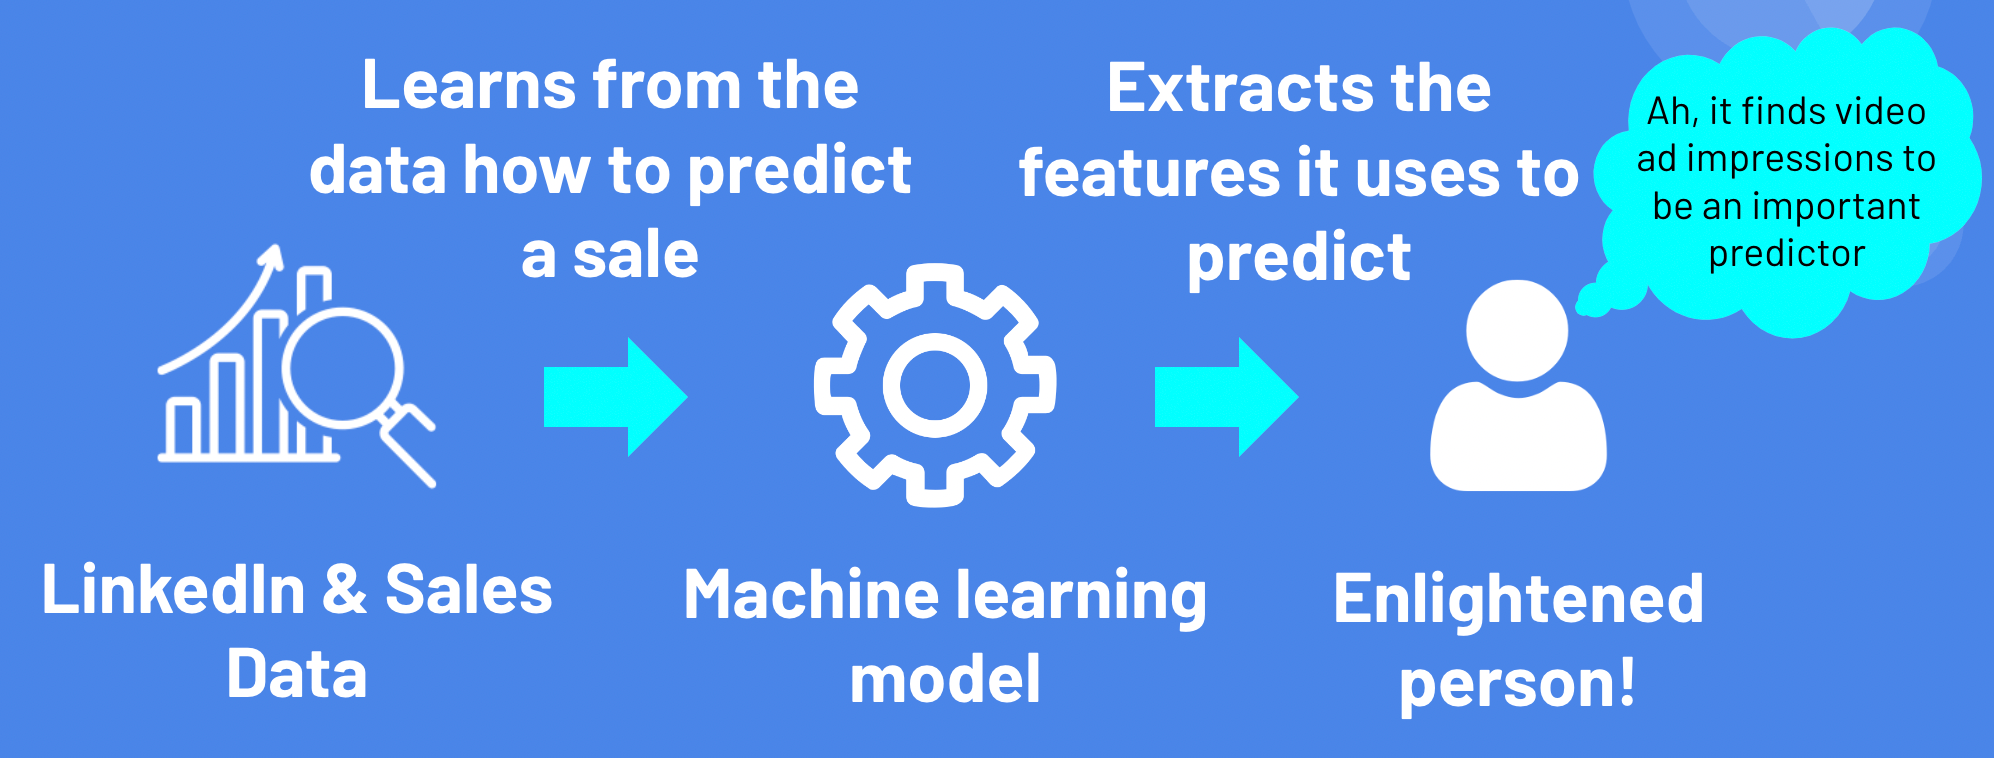
Analyzing the Results
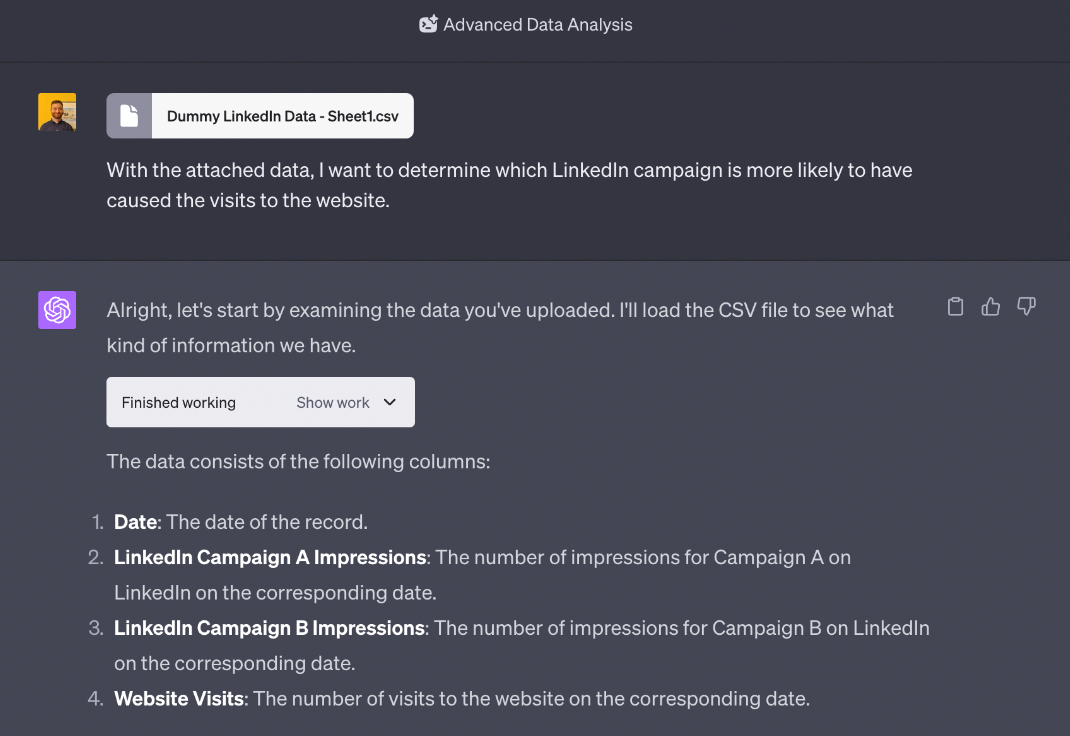
We're now going to train a machine learning model to take the data as an input and learn which features (for example, impressions by ad format) best predict whether a business will become a client.
You can just use ChatGPT's Code Interpreter to guide you through this. Here's an example prompt. Ensure you upload your data in the correct format outlined above:

If you don't have access to Code Interpreter, here's some starter code for training an XGBoost model:
# Import necessary libraries
import xgboost as xgb
from sklearn.datasets import load_iris
from sklearn.model_selection import train_test_split
from sklearn.metrics import accuracy_score

# Load the iris dataset - EXAMPLE, REPLACE WITH YOUR DATASET
iris = load_iris()
X = iris.data
y = iris.target

# Split the dataset into training and testing sets
X_train, X_test, y_train, y_test = train_test_split(X, y, test_size=0.2, random_state=42)

# Convert data into DMatrix format
dtrain = xgb.DMatrix(X_train, label=y_train)
dtest = xgb.DMatrix(X_test, label=y_test)

# Set model parameters
param = {
    'max_depth': 3,
    'eta': 0.3,
    'objective': 'multi:softprob',
    'num_class': 3
}

# Train the model
num_round = 20
bst = xgb.train(param, dtrain, num_round)

# Predict the classes
preds = bst.predict(dtest)
best_preds = [int(p.argmax()) for p in preds]

# Calculate accuracy
acc = accuracy_score(y_test, best_preds)
print(f"Accuracy: {acc:.2f}")
More about Feature Importance
Feature importance and feature engineering are really important topics for ensuring your model performs well. There are a number of different methods to assess feature importance, including using different permutations of features and different values for the assessment.
Some important points to note:
- You want to assess a similar number of organizations that did not become a sale, to the number that did become a sale (say 500 each).
- As part of your process with Code Interpreter (and included in the starter code above), you should assess the accuracy of the model. Looking at important features of a model that is less than 95% accurate isn't ideal.
- You can train various models (see other example of supervised machine learning models here) and then use the averages of the feature importance values to try and provide a robust method to get around a lack of data - but this is still only available when you have reasonable accuracy (above 85% for each model).
2. Analyzing the Impact on Website Behavior
The less sales data you have, the less accurate your model will be.
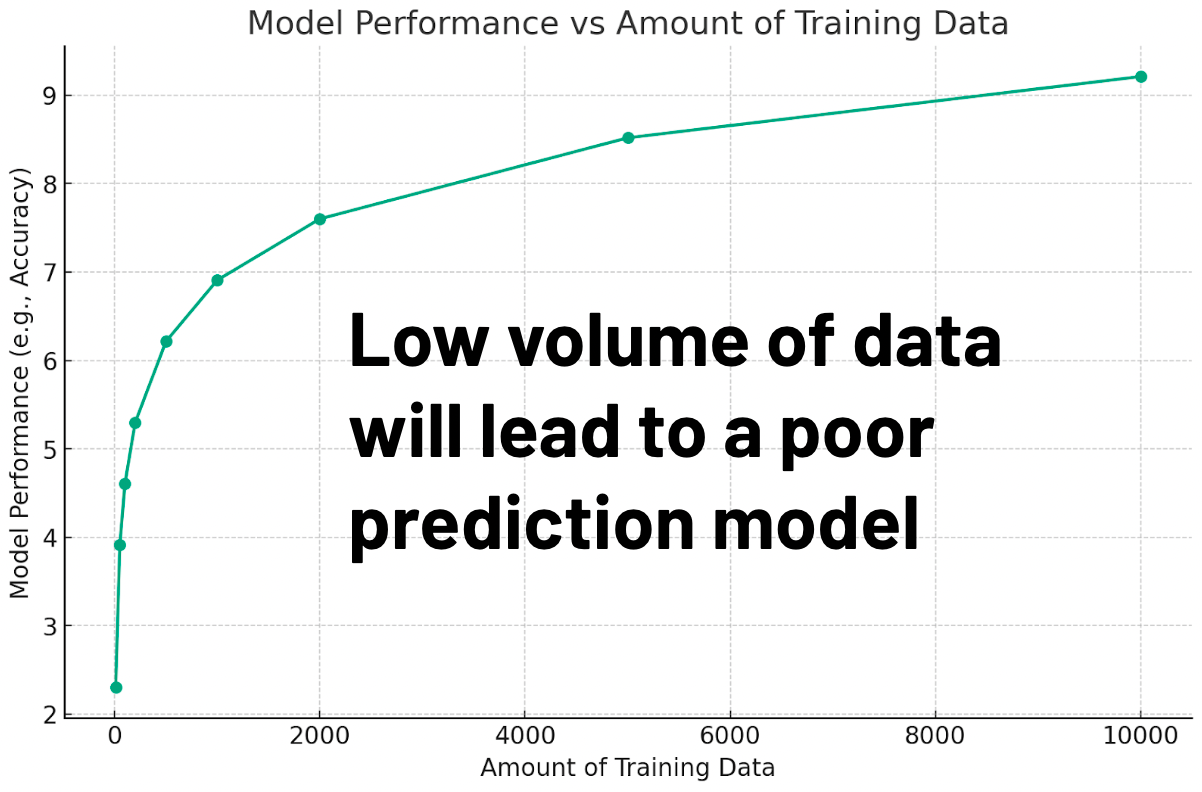
Therefore, one answer to still gain insight into the performance of your LinkedIn ads is to expand the amount of data. What if we can use micro conversions further up the funnel instead of final sales - and assess the impact of LinkedIn ad impressions on those instead?
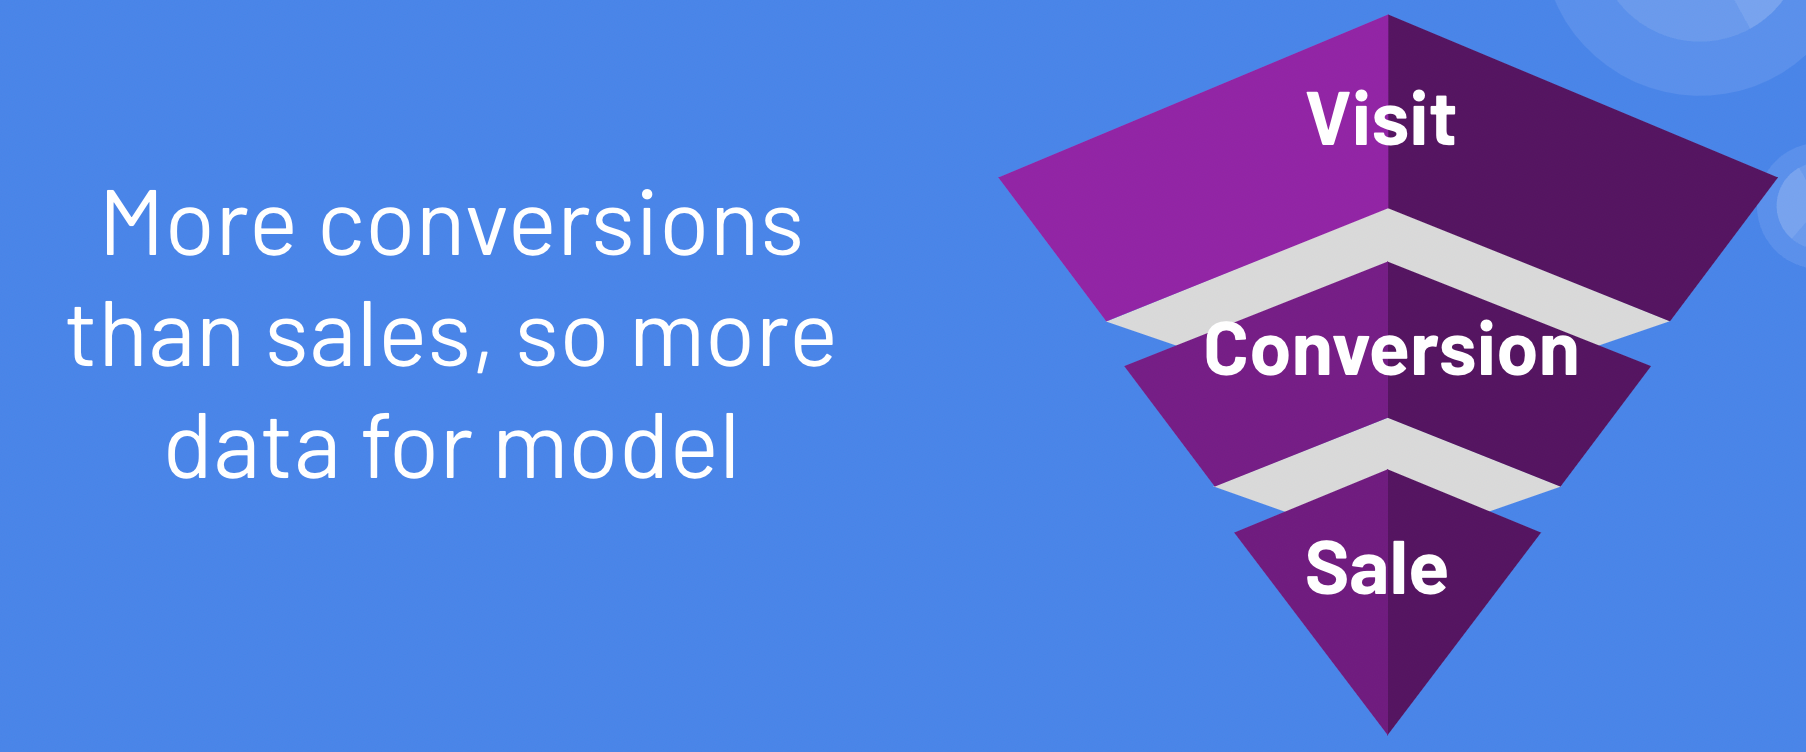
The way to do this is to lookup the IP addresses of visitors to your websites and fuzzy match those to your organization-level LinkedIn data instead.
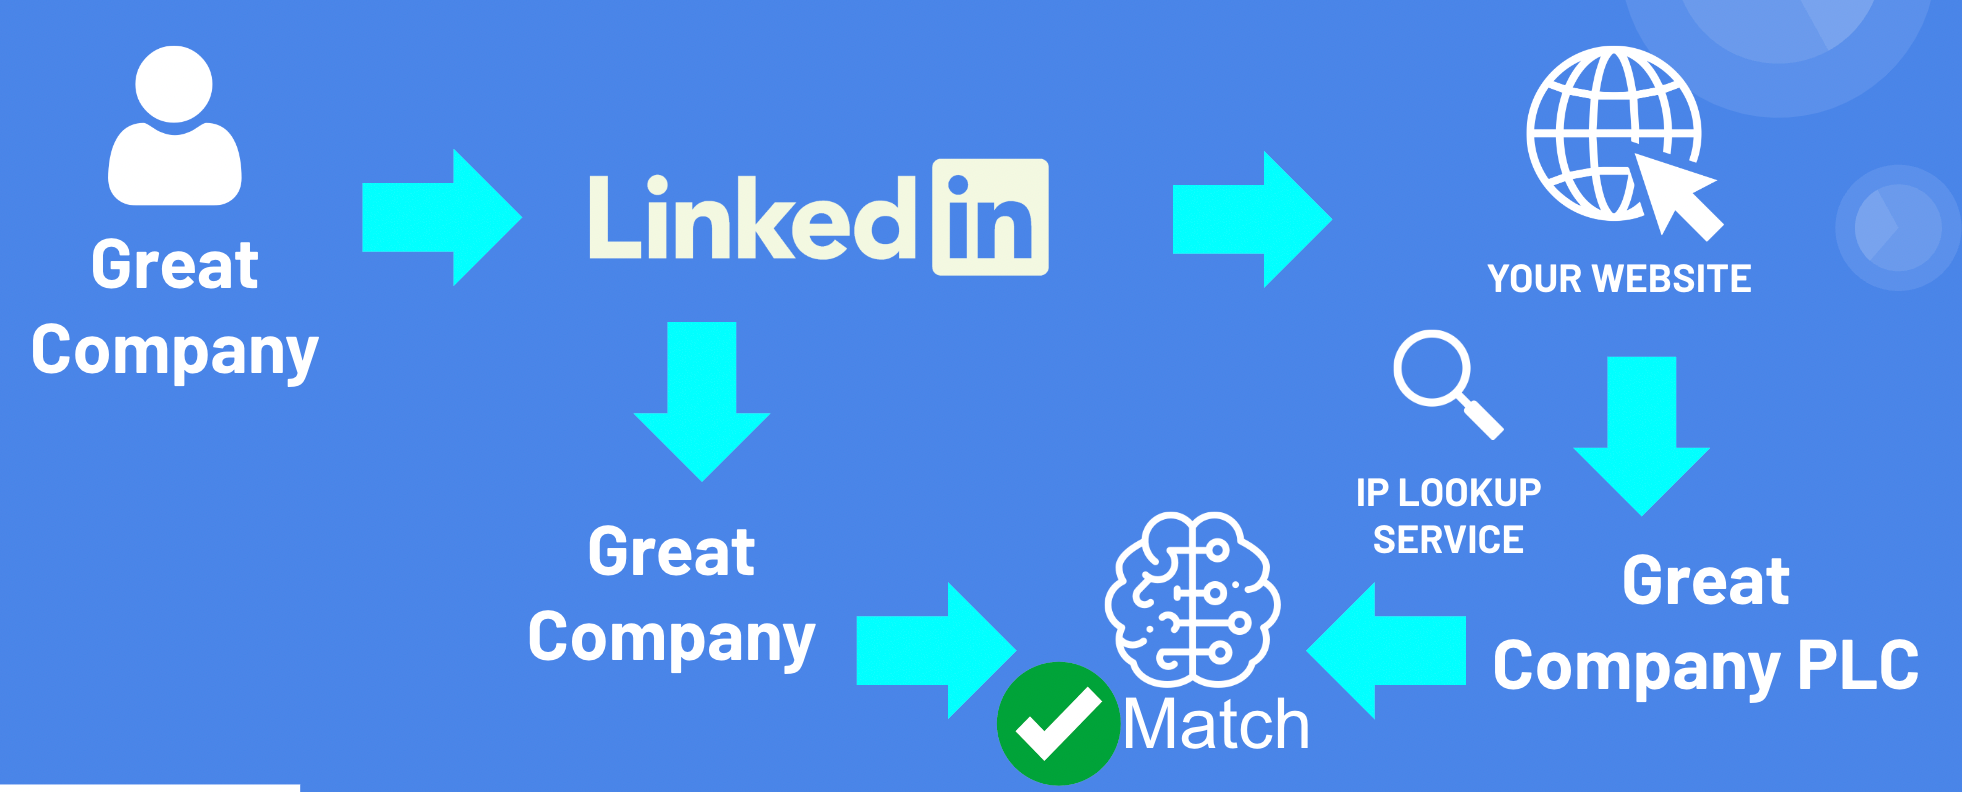
A number of services can help you do this:
This means you can see who has been on your website from the accounts you are targeting on LinkedIn, and then determine if they have behaved in a way that shows interest in your product.
Using Website Behavior Segments as Micro Conversions
Behavior segments on a website can act as invaluable micro-conversions - particularly when assessing your LinkedIdIn activity.
If you are able to identify key behavioural segments on your website that map to potential job titles on LinkedIn, then you can infer whether your job title targeting has been successful, based on the behaviour of the users that came to your website from that account.
For example, if you have a technical product and you target developers on LinkedIn, then users from that account spend a lot of time in your product, you know you've reached and got your message to the right people.
Here's a presentation I did at MeasureFest about how to cluster your website users based on their behaviour:
Want to Learn More about Clustering?
Clustering is an unsupervised machine learning technique that finds patterns in your data and can be really useful for audience segmentation. There are lots of different algorithms to use. We have created a full guide with walkthrough and code examples.
The Advantages of Event Data in GA4
GA4 (Google Analytics 4) has actually made this analysis a lot easier, by being events' focused. This means that for each user, you can get individual data points about their behaviour, such as URLs they've visited.
This analysis is much easier if you connect your Google Analytics 4 account to BigQuery:
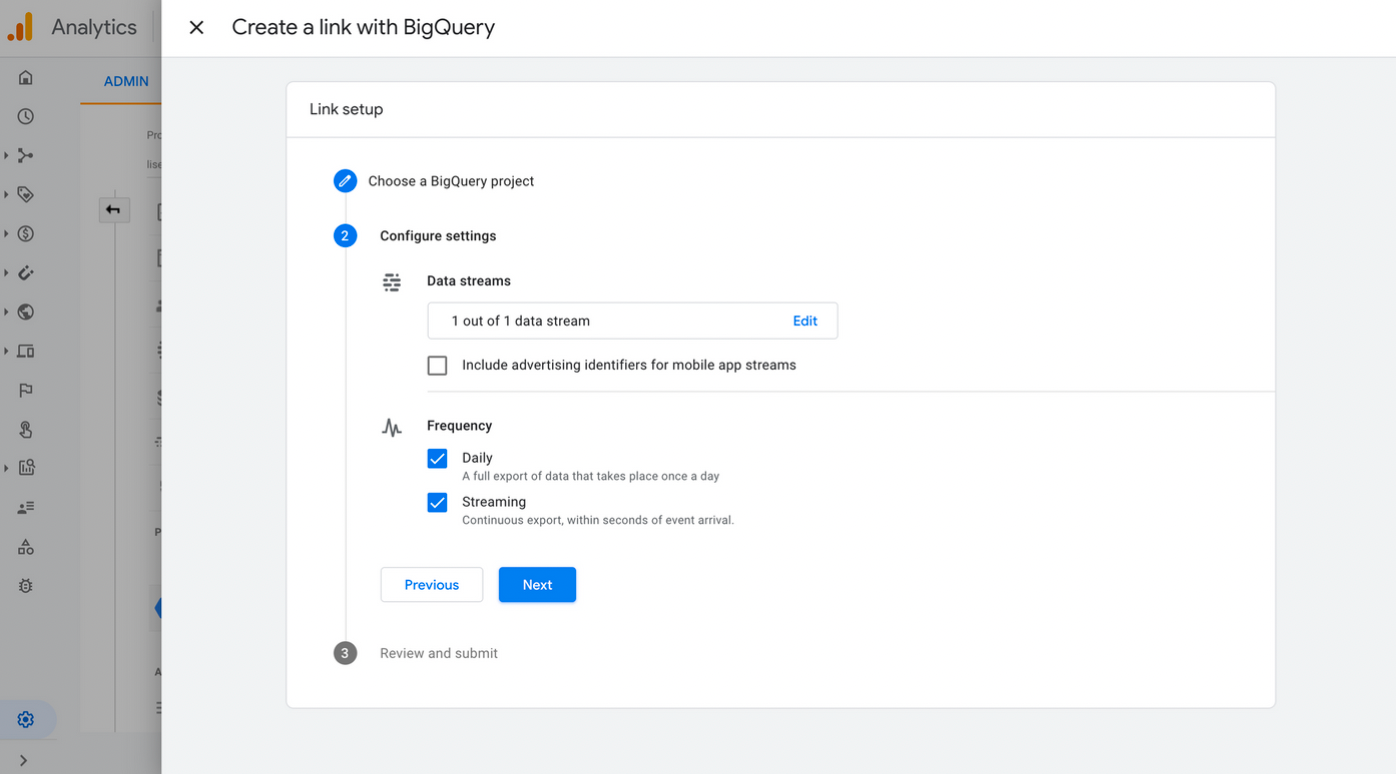
You should do this as soon as possible, as the data does not backdate.
Correlating Time Proximity of Impressions and Website Visits
You can also perform a correlation analysis between ad impressions and website visits. Did ad impressions for an account happen in close proximity to when the website visits from that account occurred?
Code Interpreter can help again here, if you need:
This can help in further discerning the impact of LinkedIn ads on website interactions and micro conversions.
How you can take this further
The insights derived from LinkedIn can be instrumental in shaping strategies for other channels. You can take your learning about the kinds of content that perform well on LinkedIn into your organic search strategy, for example.
You can also add extra channels when training your supervised machine learning model:
Summary
LinkedIn ads can offer much more value than businesses might initially realize. By setting up the LinkedIn API and tapping into the power of tools like GA4, businesses can unearth deep insights that go beyond mere clicks. By using platforms like ChatGPT's Code Interpreter to walk you through some of the technical aspects, you can really unlock the potential for LinkedIn ad analytics.